Ananya_Kaushik - Bioinformatics (Level 2) Pathway

Week 1 Self Assessment

Things Learnt:

Technical:

  • Reading a scientific paper- Analysing the different methods used for study and how to interpret their results to draw meaningful conclusions
  • Installing R and RStudio and additional packages
  • Fundamentals of R programming-syntax, debugging, visualisation

Tools:

  • STEM-Away Platform
  • R console, R studio

Soft Skills:

  • Using team collaboration platforms
  • Interacting and collaborating with other members for journal club and presenting our findings
  • Time Management: Working as a STEM-Away participant while working on other projects and also adjusting to the difference in time zones

Achievement highlights:

  • Gaining a further understanding of the transcriptomics pipeline
  • Learning how to use R
  • Getting an overview of the internship and its aims and objectives.

Difficulties Faced:

  • I found the STEM Away forum and dashboard hard to navigate at first. But after following the tutorial, I was able to use it easily.
1 Like

Module 2 Self Assessment

Things Learnt:

Technical:

  • Installing the required Bioconductor packages: affy, affyPLM, affyQCReport, simpleaffy
  • Using the GEO database, by following Ali’s tutorial
  • shiny package - Learnt the basics of Rshiny and designed an app using the air quality dataset, that plots a histogram and normal distribution curve for the different parameters, gives summary statistics and displays the dataframe.

Tools:

  • Rshiny
  • R studio
  • GitHub
  • GEO Database
  • CEL file types

Soft Skills:

  • Time management- finishing my tasks on time so I can have more free time during the rest of the week and also working ahead on module 3
  • Teamwork/ Collaboration- communicating the problems and roadblocks to my team members or technical leads when I am feeling stuck so that they can help me out
  • Learning to work with Rshiny and troubleshooting required a lot of trial and error, which requires time and patience

Additionally,

  • I also had interviews with two of the UX teams and explained to them— the pipeline, the aim of our project, as well as the requirements for the app we would be making. I also gave them my insights on the design of existing web-based bioinformatics tools from personal experience and how they could be made more user friendly. Moreover, talking to them helped me also gain more clarity on our project.

Achievement highlights:

  • Creating a functional R shiny app, especially working with reactivity
  • Being able to design the UI of my Rshiny app to look however I wanted
  • Using the GEO database to extract different types of information
  • Successfully loading the dataset into R

Difficulties Faced:

  • I initially struggled with working on the shiny app since I had no previous experience. However, Samuel helped me with all the problems I faced.
  • I was using R 4.1 and could not figure out why I wasn’t able to install some of the Bioconductor packages. Ivan then helped me with installing the R 4.0 version to fix it.

Module 3 Self Assessment

Things Learnt:

Technical:

  • Generating Quality Control reports
  • Identifying some outliers from the QC stats plot
  • Performing normalisation and background correction using RMA
  • Generating RLE and NUSE boxplots and summary statistics
  • Learning the purpose behind performing quality control and data pre-processing
  • Learning more about data visualisation using PCA and heatmaps

Tools:

  • R studio / R cloud
  • Packages- simpleaffy, arrayQualityMetrics, affyQCReport, affyPLM
  • Github

Soft Skills: Time management, Virtual Collaboration with my group members, working with other team members and helping each other out when we face certain problems or roadblocks, collectively coming up with solutions for them.

Achievements:

  • Tried more than one method of performing quality control and normalisation
  • Interpreted and presented our results
  • Identified some outlier values by comparing samples using the geo2r table

Difficulties Faced: affyQCreport takes a lot of time and memory to run and Rstudio kept crashing when I tried to run it on my laptop

Module 4 Self Assessment

Things Learnt:

Technical:

  • Removing outliers from data
  • Gene annotation and gene filtering
  • Limma Analysis
  • Generating a volcano plot
  • Other methods of visualising the top differentially expressed genes (DEGs)
  • Analysing selected samples in geo2r

Rshiny app: This week I also worked on designing a general layout for grouping of samples along with Aditi in group B2 using Figma.

Tools:

  • geo2r
  • EnhancedVolcano
  • Limma
  • hgu133plus2.db

Soft Skills:

  • Collaborating with my team member Leila this week
  • Asking other groups for help and learning from their mistakes while troubleshooting, comparing my code and results with theirs
  • Presentation skills

Achievements:

  • Successfully performed gene annotation and gene filtering
  • Successfully generated a table of top DEGs and volcano plot that matched with geo2r values

Difficulties Faced:

  • I initially faced some difficulty in creating the desired design matrix and contrast matrix
  • After that I was able to generate a volcano plot with only the probe ids and had some trouble with the gene annotation. However other team members like Leila, Ivan and Arian helped me out a lot with that part!

Module 5 Self Assessment

Things Learnt:

Technical:

  • Selected up-regulated genes by setting a threshold for logFC values
  • Performed enrichment analysis for the KEGG database
  • Generated a dot-plot of top enriched KEGG pathways

Tools:

  • org.Hs.eg.db
  • clusterProfiler
  • enrichKEGG

Soft Skills:

  • Communicating with my team members about our progress and solving problems we faced
  • Presenting my findings
  • Time management
  • Discussing the layout of the app together with other group B2 members

Achievement highlights:

  • Generating different dot plots for enriched KEGG pathways by changing the threshold values and p-values.

  • Exploring how our DEGs are associated with various biological pathways using the KEGG database
  • Exploring how other enrichment analyses can also be done

Difficulties faced:

  • Initial confusion about what should be used as the threshold value and whether we should perform analysis for upregulated genes or downregulated genes or both

Module 6 Self Assessment

Things learnt:

Technical/Tools:

  • Performed pathway enrichment using 3 web based tools–Enrichr, DAVID and Metascape
  • Explored other functional analyses using these tools as well
  • Also explored results using Reactome and Wikipathways besides KEGG

Soft Skills: Collaborating with my teammate Shreya this week, Time management, Presenting our findings

Achievement Highlights:

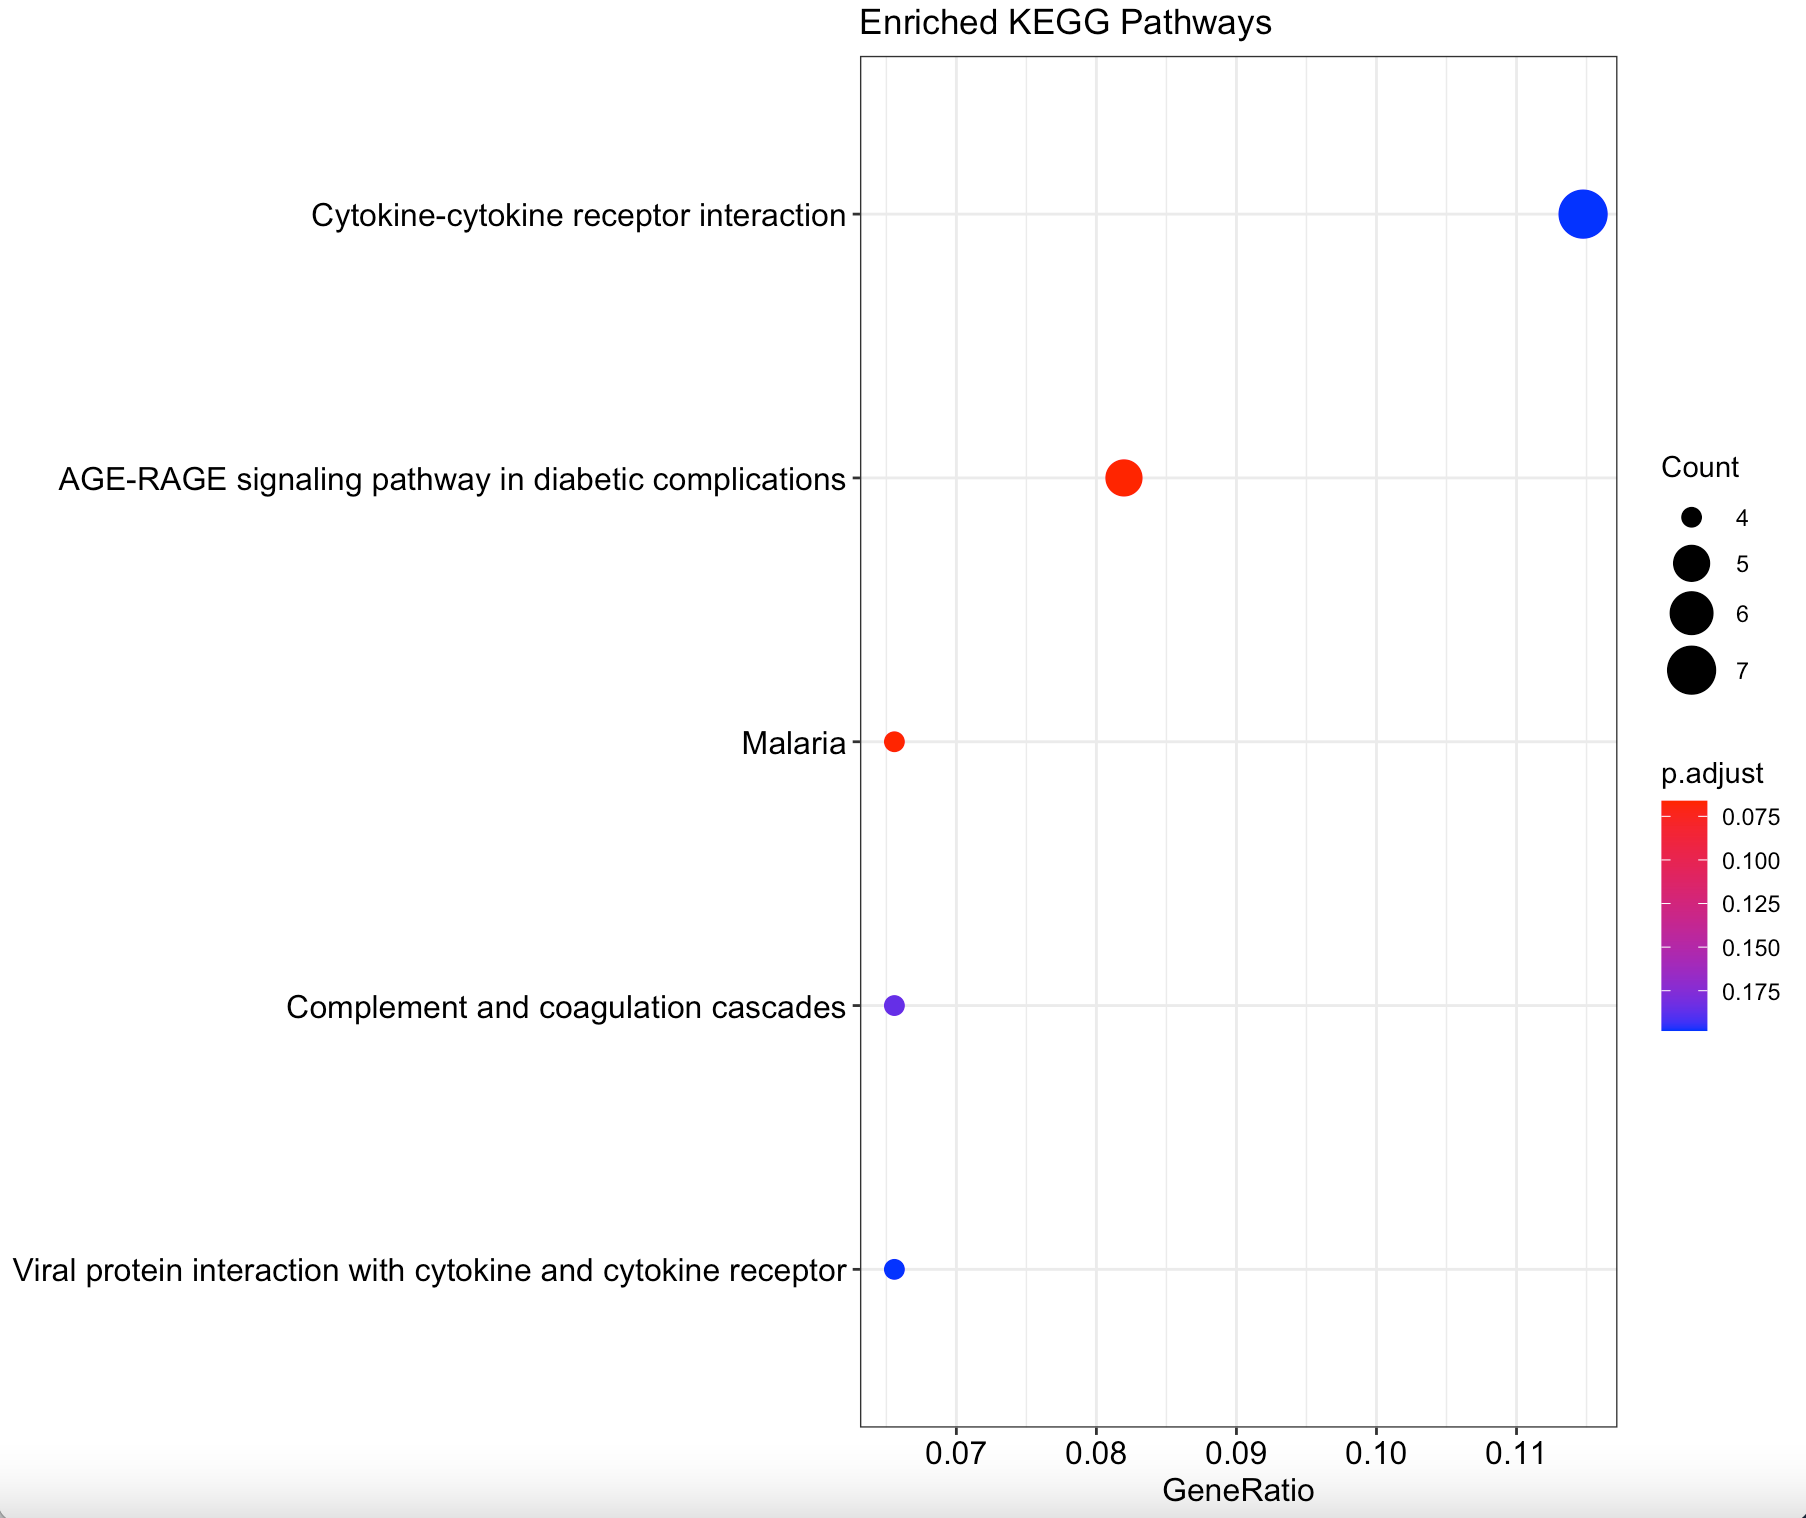
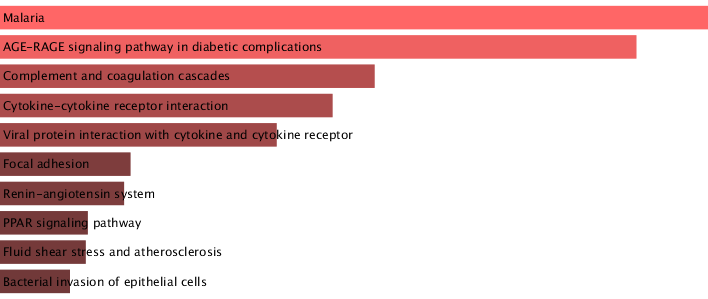
  • Successfully generated results that matched our results from module 5, where Malaria and AGE-RAGE signalling pathway were highlighted as top enriched KEGG pathways

Results using Enrichr:

Difficulties faced:

  • Initially, Shreya and I faced some difficulty using DAVID and how to visualise our data on it

Week 7 self Assessment

Things Learnt:

Highlights:

  • @ivanlam27 and I also explored the GSE61196 dataset for Alzheimer’s Disease before finally working on colorectal cancer

  • Worked on displaying grouping of samples and DEG analysis for the app layout

  • Pitched the idea of using the jumbotron function in bs4dash

  • Used code from all previous modules to perform statistical and functional analysis for colorectal cancer

  • Compared our results with results from web based functional analysis tools

  • Researched relevant literature on our top 3 DEGs: CCN1, FOS, VIP

  • Presenting our findings for the capstone project

1 Like